
CFOs are being asked to deliver profitable growth with fewer net-new headcount and a tighter tech stack. Managed services can help, but only if you have a rigorous way to forecast, realize, and verify the return. This practical guide shows how to build a defensible financial model, what to instrument, and how to negotiate contracts so the ROI actually shows up on your P&L and cash flow.
The CFO scoreboard for managed service ROI
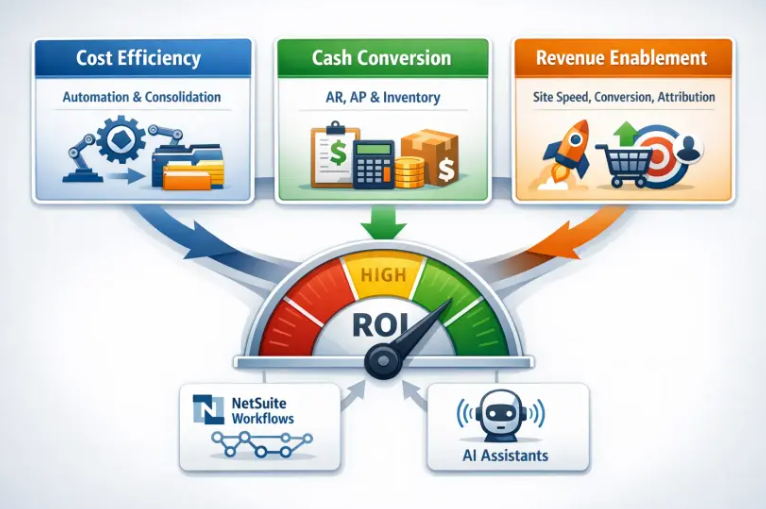
Think about ROI across four lenses, not just cost takeout:
| Lens | Primary metric | Where it shows up | Example levers |
|---|---|---|---|
| Cost efficiency | Operating expense reduction, cost to serve | Operating expenses | Workflow automation, support coverage, SaaS consolidation |
| Cash conversion | DSO, DPO, inventory turns, CCC | Working capital and cash flow | AR automation, invoice accuracy, procurement discipline, inventory planning |
| Revenue enablement | Incremental gross profit | Gross margin and net revenue | Faster quote to cash, funnel optimization, attribution clarity |
| Risk and resilience | Incident rate, audit findings, recovery time | Risk exposure and compliance cost | Integration reliability, security posture, change control |
If NetSuite is in scope for finance and operations, your ROI levers often sit in order-to-cash, procure-to-pay, and inventory workflows. For an overview of the platform, see what NetSuite is.
Establish the baseline before you model benefits
Your business case is only as credible as your baseline. Capture the following for the last two to four quarters:
- Labor hours by process and role, loaded rates, error and rework rates
- Cycle times for key workflows, for example lead to opportunity, quote to cash, procure to pay
- Finance and cash metrics, for example DSO, DPO, inventory turns, cash conversion cycle
- Revenue engine metrics, for example site conversion rate, MQL to SQL, win rate, average deal cycle
- Reliability and quality, for example integration failure rate, incident minutes, rollback frequency
Two cash metrics matter in almost every managed engagement:
- Days Sales Outstanding, definition and formula at Investopedia
- Cash Conversion Cycle, overview at Investopedia
The three benefit buckets you should model
1. Cost efficiency, hard savings and capacity
- Automation and assistants, for example triaging support tickets, generating routine reports, and data entry between systems
- Integration reliability, fewer manual retries and fewer defects
- SaaS consolidation, retiring redundant tools and connectors
Model formula: Hours saved x loaded hourly rate x adoption rate.
2. Cash conversion, free cash and interest savings
- Faster and cleaner billing, earlier invoicing and fewer disputes
- Collections assistance, prioritized follow up and better payment options
- Inventory planning and procurement discipline, better turns and volume pricing
Model formula: Change in DSO or inventory days x average daily sales or COGS x cost of capital.
3. Revenue enablement, incremental gross profit
- Quote to cash acceleration, shorter cycle times increase closed revenue in period
- Website and funnel performance, higher conversion and qualified pipeline
- Better attribution, marketing mix shifts to higher return channels
Model formula: Incremental revenue x gross margin percentage.
If web development is part of scope, small speed gains can translate to material revenue on high traffic pages. GitHub's research also shows AI-assisted developers complete tasks faster, which supports the case for AI-accelerated delivery timelines.
A worked example you can adapt
Use this structure with your own numbers. Values below are illustrative, not a promise of results.
Assumptions
- Annual revenue 100 million dollars, gross margin 40 percent
- 10,000 annual hours saved through automation and integration reliability
- Loaded hourly rate 80 dollars, adoption 70 percent
- DSO reduction of 8 days
- Incremental revenue 1.5 million dollars from funnel and conversion improvements
- Program cost equals P dollars per year
Calculations
- Efficiency savings: 10,000 x 80 x 0.70 = 560,000 dollars
- Cash benefits: freed cash from DSO, 8 days x 100,000,000 dollars per 365 days ≈ 2,191,780 dollars, interest benefit at 6 percent, about 131,507 dollars per year
- Revenue enablement: incremental gross profit, 1,500,000 x 0.40 = 600,000 dollars
- Total annual quantified benefits: about 1,291,507 dollars
Financial metrics
- Simple ROI: (1,291,507 - P) ÷ P
- Payback months: P ÷ (1,291,507 ÷ 12)
- Optionally compute NPV and IRR with your discount rate, include ramp and risk adjustments described below
Risk adjust the model so finance can defend it
Improve credibility by discounting benefits for adoption, data quality, and scope risk. A simple approach is to apply a probability-weighted factor per bucket.
| Bucket | Typical risks | Example risk factor |
|---|---|---|
| Efficiency | Adoption stalls, process variance, exception volume | 0.7 to 0.9 factor applied to hours saved |
| Cash | Data mismatch, dispute backlog, policy drift | 0.6 to 0.85 factor applied to cash benefit |
| Revenue | Traffic volatility, seasonality, attribution noise | 0.5 to 0.8 factor applied to incremental GP |
Document the ramp, for example 50 percent of run-rate benefits in quarter one, 80 percent in quarter two, 100 percent in quarter three once change management and training complete.
The minimal data package your vendor should accept
- Baseline metrics and time series for the scoreboard above
- Process maps or at least swimlanes for the targeted workflows
- Access to current integration inventory, error logs, and retry counts
- System and tool list with contract end dates, relative usage, and costs
- A RACI for decisions that change policy, billing terms, or customer communications
A 12 month ROI roadmap template
Use this to sequence value while managing risk.
| Quarter | Primary objectives | CFO visible outcomes |
|---|---|---|
| Q1 | Quick wins in AR automation, top 3 manual handoffs between systems, critical dashboards | Hours and error reduction visible, earlier invoicing, first DSO movement |
| Q2 | Scale automations, stabilize integrations, retire redundant tools | Consolidation savings, more predictable cycle times, SLO adherence |
| Q3 | Revenue enablement, site speed and conversion improvements, quote to cash acceleration | Incremental revenue contribution, improved pipeline quality |
| Q4 | Optimization and governance hardening, annual benefits review | Full-year ROI documented, baseline reset for next cycle |
Vendor evaluation checklist for CFOs
- Contract clarity: fixed monthly pricing, change control, and explicit out of scope list
- Value tracking: vendor agrees to a quarterly benefits review and to use your baseline
- Security and compliance: proof of data handling standards and incident response discipline
- Bench depth and continuity: who covers vacations and turnover
- Cross functional capability: operations, marketing, and technology under one accountable lead
- Integration and ERP expertise: proven NetSuite and unified system integration track record
- References: from companies of similar size and complexity
To understand how a managed partner slots into a mid-market team, read what a managed partner brings to mid-market teams.
How to present the business case to your CEO and board
- Lead with the scoreboard: cost, cash, revenue, risk
- Show the baseline, then the model with conservative risk factors and a clear ramp
- Call out the measurement plan and governance cadence up front
- Tie early milestones to non-negotiable outcomes, for example specific DSO and cycle time targets
- Provide two scenarios, base and stretch, and commit to re-forecast quarterly
Measurement plan and governance
- Weekly: operational metrics by workflow, adoption, throughput, error rates, incident minutes
- Monthly: CFO view of cost, cash, and revenue benefits with variance analysis
- Quarterly: benefit realization review with the vendor, update forecasts, adjust scope
- Annual: true-up of the realized ROI, keep a running ledger of quantifiable benefits
Embed the tracking directly in your ERP and analytics stack. If NetSuite is your system of record, tie automation events to transactions so savings and cycle time improvements are audit friendly.

Frequently asked questions
What payback period should a CFO target for a managed service?
Many mid-market CFOs aim for initial payback inside 12 months, with clear quick wins in the first two quarters. Your target depends on scope, baseline maturity, and cost of capital.
How do I prevent soft savings from padding the model?
Only count soft savings when they translate into hard budget decisions, for example redeploying FTE capacity to a funded backlog or avoiding planned hires. Track the redeployment explicitly.
How should I treat freed cash from DSO and inventory improvements?
You can model interest savings using your cost of debt or opportunity cost using your WACC. Be consistent across initiatives and show your assumptions.
What if benefits are shared across departments, for example marketing and sales?
Define attribution rules before the program starts and use them in your ledger. CFOs often split by agreed contribution or attach the benefit to the owner that can sustain the process change.
How do I evaluate AI automation risk?
Require guardrails, for example human-in-the-loop for external communications, audit logs for AI-assisted actions, and clear rollback procedures. Start with contained tasks where the error cost is low.
Which KPIs move first when NetSuite process automation is in scope?
Common early movers include invoice creation cycle time, unapplied cash, dispute rate, and integration retry volume. Over time these changes tend to reduce DSO and manual hours while improving forecast accuracy.
Bringing it together with DataOngoing
DataOngoing delivers managed services purpose built for mid-market companies, combining AI automation and assistants, ERP integration expertise, unified system integrations, AI-accelerated web development, and data driven digital marketing. The operating model emphasizes fixed monthly pricing, enterprise reliability, scalable partnerships, and a proven ROI focus. If you want to pressure test your business case or align your roadmap to measurable cost, cash, and revenue outcomes, talk to our team at DataOngoing.
DataOngoing Team
Technology Consulting Experts
DataOngoing helps mid-market companies achieve measurable ROI through AI automation, ERP expertise, and digital transformation.